
With this new update, the main problem we were trying to solve was how we can help the user break down all the information faster and how can they implement it into their trading strategy quicker.
Since the initial launch of our AI power alerts feature, we received a ton of feedback which helped us understand where improvements can be made. Because of this, we were able to improve our logic that powers our algorithm and more importantly, provide visual markers of where and when the alerts were being triggered. Not to mention, we added in a good amount of new information to display.
The main idea is to provide rich information to our users. This is not intended to be used as a trading bot. The system isn’t perfect. The overall focus should be around the data each power alert captures and how it can be implemented into your ideas for execution.
Data breakdown
Let’s review all the new information that is now being presented when you drill deeper into a specific power alert.
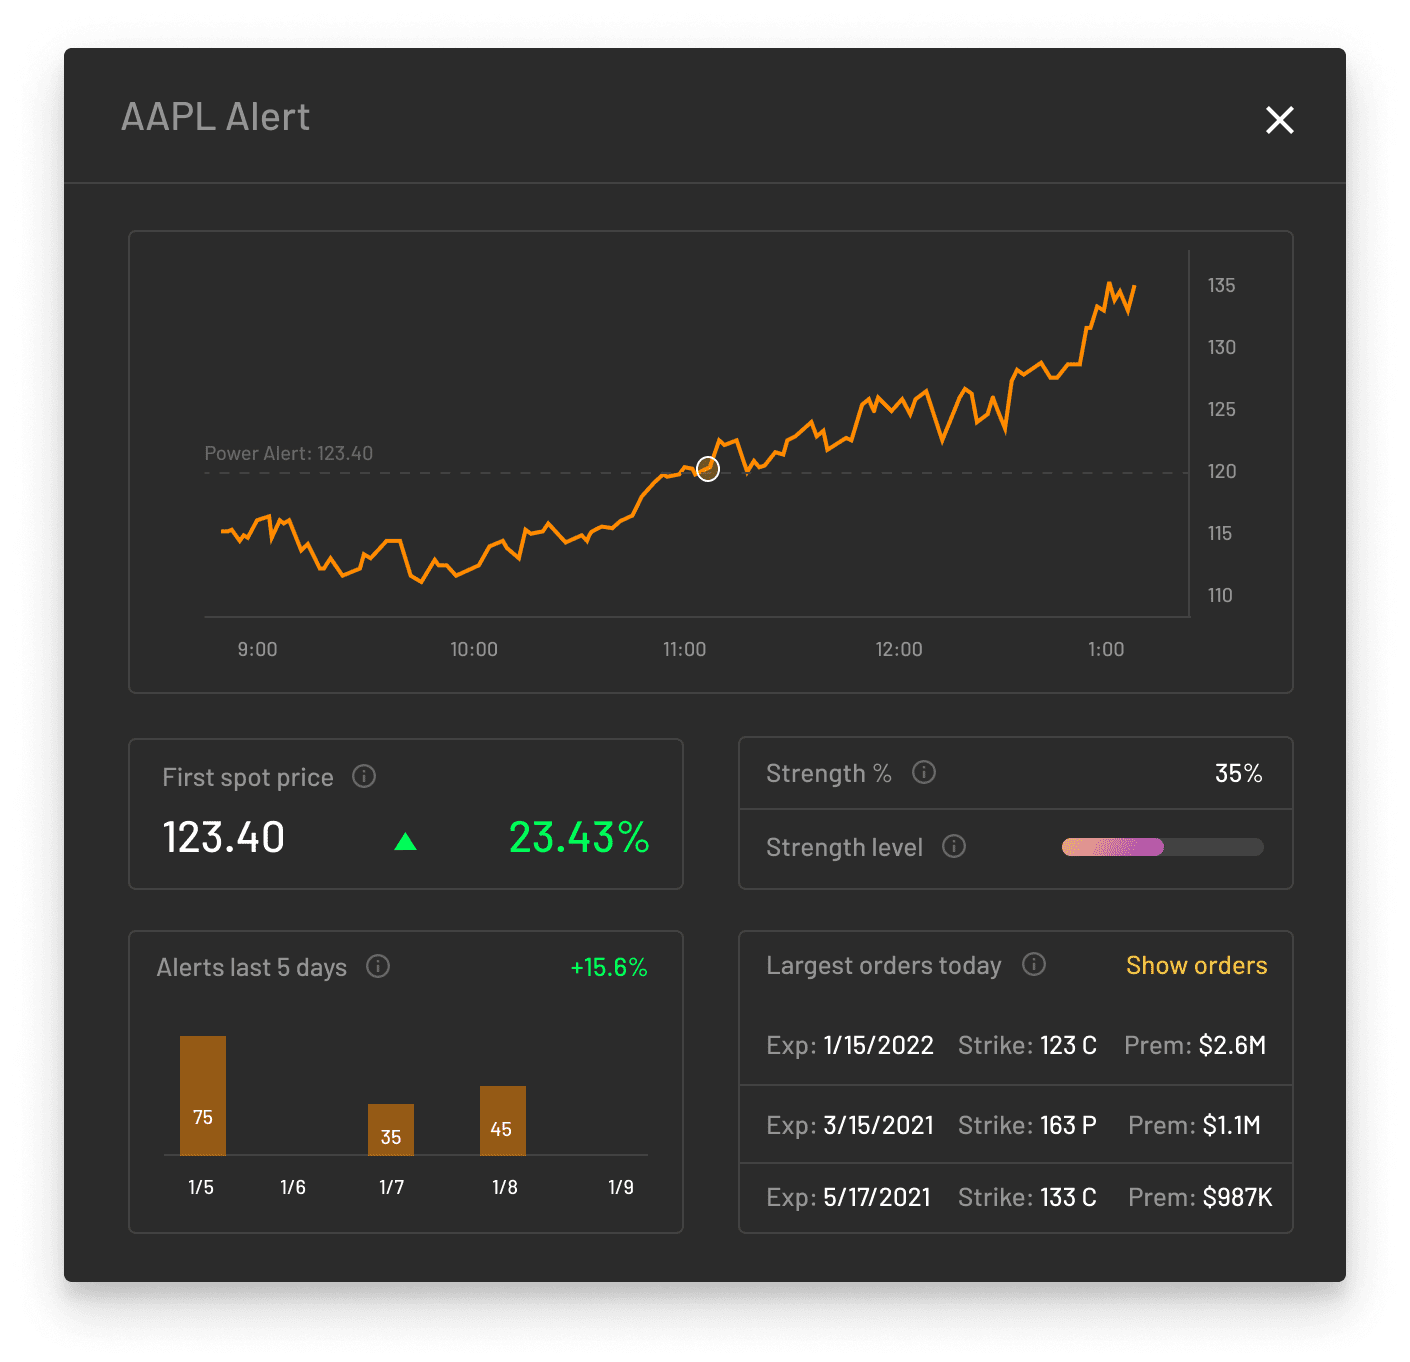
- Interactive real time chart: You will now have a visual marker of where the power alert was triggered and see how the intraday movement of the stock price is going.
- First spot price: This is where the magic happens. Once our algorithm triggers the alert, we take the spot price that was captured and monitor the movement with a profit / loss calculation that gets updated throughout the day.
- Strength percentage and level: A general display of how the strength is moving throughout the day based on what our algorithm is seeing.
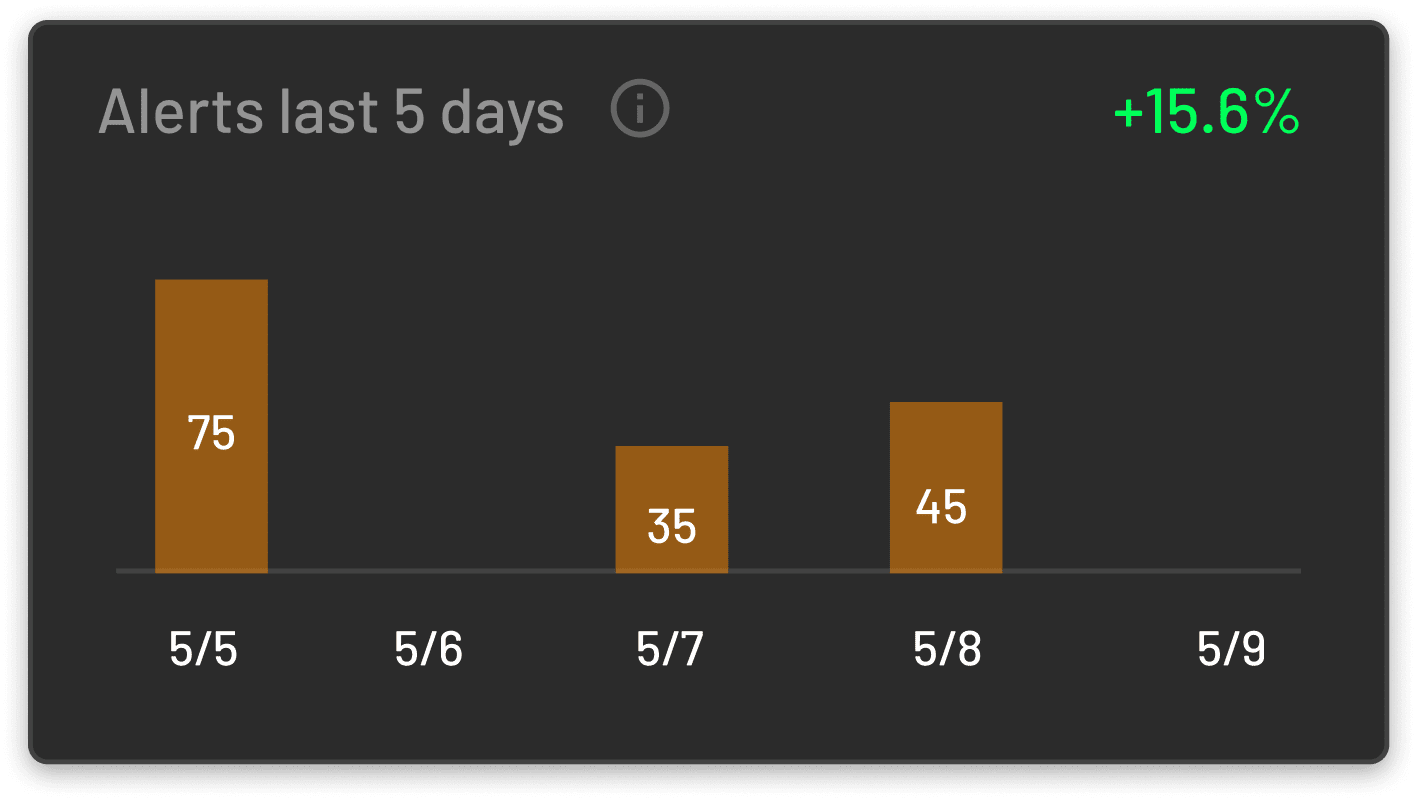
- 5 day alert history: The bar chart will show you how many times a stock has triggered a power alert for the week. Additional, the system will display a percentage gain or loss calculation at the time it first appeared and compare it to the current days spot price signal so you can see how successful the alert was.
- Largest orders today: Our system will scan the largest orders coming through the tape for the particular stock and display it for you.
How to use the information
The rich data information that is generated by our algorithm to trigger the power alert spot price can be used to aid your decision making if you mostly day trade. After some analysis from previous results, we found that each alert was highly successful within a 30 – 60 minute time window. Use the initial spot price to aid in your technical analysis setup and adjust your stop loss accordingly to the relative support and resistance price points.

Additionally, try focusing on how many alerts come into a specific symbol for the week. If a stock just has one power alert in the last 5 days, consider adding it to your watchlist and pay attention to the price action as there may be additional activity coming into the name in the future. If there are consecutive days (3-5) being triggered with a positive percentage calculation (located top right), institutions are actively coming into the stock which may result in further upside potential. A full technical analysis strategy should always be considered when trading.
Final thoughts
Be patient with the information that is being presented and over time, you’ll be able to incorporate the data to aid in your trading setup. Remember, our goal of this feature is to help you dig through all the information faster and make wiser decisions. It’s not always going to be perfect with consistent winners as this information is mainly for reference only. Options order flow information can become fragmented but this is one step closer to making it more digestible for everyone.


